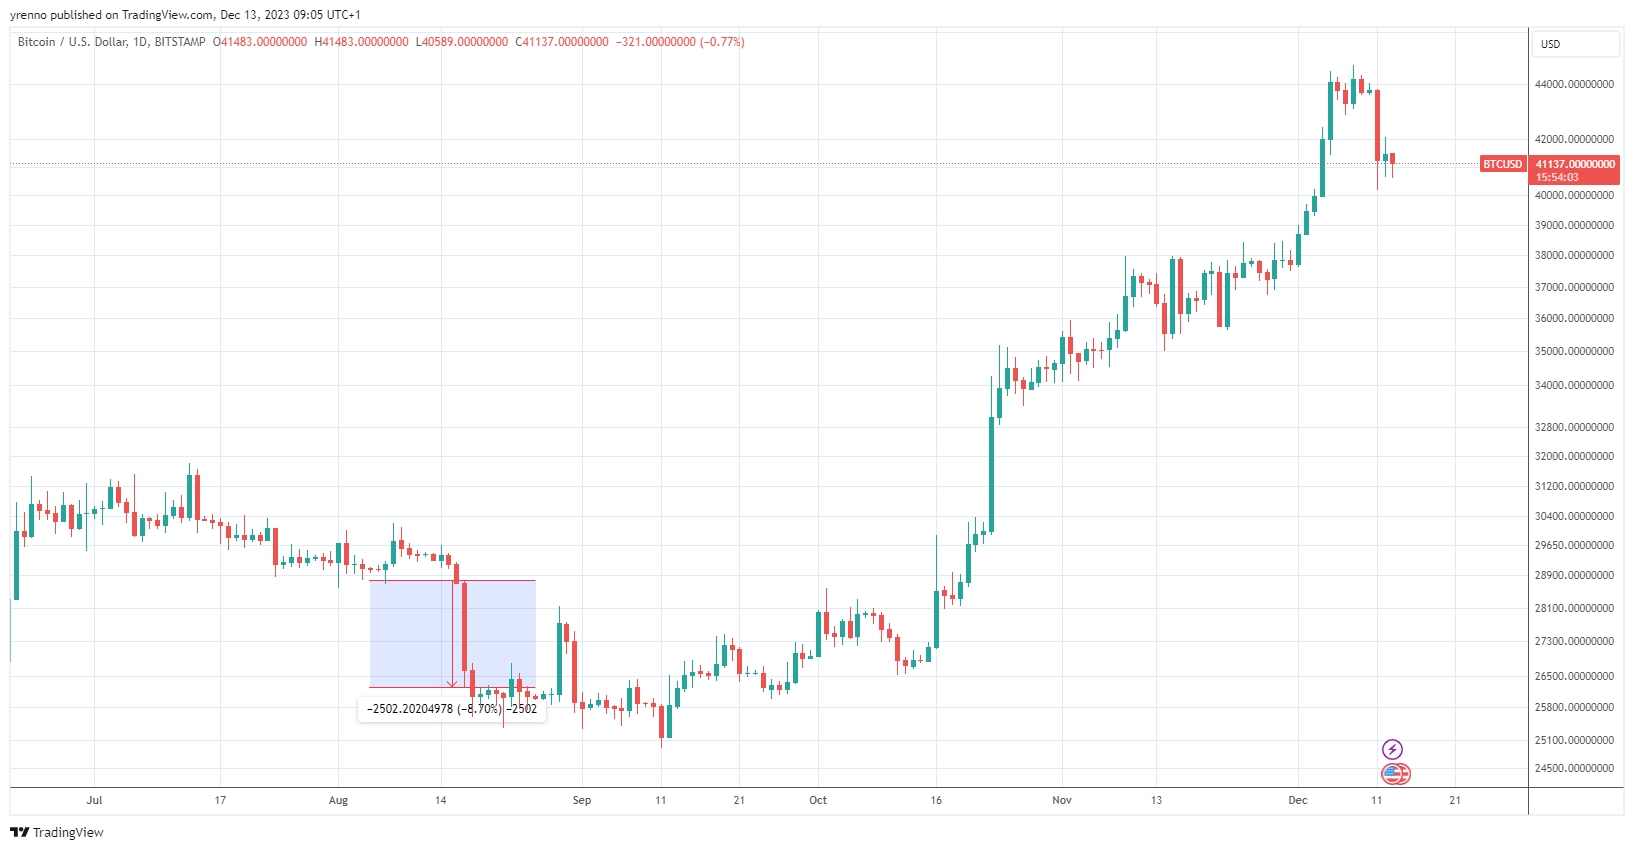
Markets are down this week from their annual peak. The Bitcoin price is now circling around 41,000 after reaching its annual high at 44,705 us dollars on Friday according to Coinmarketcap. It is down 5.5% this week, and it’s down 8% since Friday. The price of Ether is at 2,172.9 us dollars, down 4.2% this week.
Altcoins performances are scattered, With Avalanche’s AVAX and Cardano’s ADA that are still up more than 30% this week, when Chainlink or Dogecoin are down by nearly 10%.
We mentioned over the past weeks that the market was highly leveraged: the US dollar open interest in Bitcoin futures reached its highest level since December 2021. It was near an all-time high on the Chicago Mercantile Exchange (the CME).
On Monday, more than 500 million dollar's worth of future contracts were liquidated. 455 million dollar's worth of long positions. It is the worst level observed in the past three months by far.
The level is comparable to the forced liquidations observed on June 10 when the SEC initiated its lawsuits against Binance and Coinbase. But it is twice as low as liquidations observed in the height of the liquidity crisis on August 18th, where the Bitcoin price dropped more than 8% from its intraday high to its intraday low.
Speculative traders are just taking profit. How can we support this statement? We can have a look at the option market.
The distribution of the open interest across strikes and maturities can give us some insight on the traders' views over specific horizons.
Today, we’d like to go over the options market. It’s a quick overview but we think it’s important because the Bitcoin and Ether markets are highly leveraged for several reasons. Some reasons are structural: for example, the physical Bitcoin supply and liquidity are limited when future markets are much more liquid. We mentioned last week that to get a short exposure on Bitcoin, it’s easier to sell futures. It’s easier than to find physical Bitcoins to borrow and short sell.
So what is an option exactly?
An option contract is essentially an insurance contract: we can buy a call option on Bitcoin to insure against a bull market or an extreme rally. And we can buy a put option on Bitcoin to insure against a bear market or a price crash. These are the Deribit option markets. We can select the expiration of the contract, and we have the available strikes in the middle. We have the calls on the left, and the puts on the right. And every half of a line here is a market.
We can buy a call option expiring on the 29th of December with a strike at 40,000 dollars: the ask price is 0.0595 Bitcoins or 2,462 dollars. This option would protect us against a Bitcoin price rally above 40,000 dollars. If the rally happens and we reach prices way above 40,000, then we would essentially have the equivalent of one Bitcoin per contract. We’d have almost the exact market exposure that we’d have if we just bought 1 physical Bitcoin. But eventually, we would have one Bitcoin worth much more than 40,000 dollars that we would have bought for 2,400 dollars. So, the leverage here is significant.
If we don’t have 2,400 dollars, we can still buy a fraction of this call option. For every option contract that you see here, there is an almost equivalence between the price in Bitcoin, and the implied volatility level. By definition, the implied volatility is an input data level that we inject into a formula called the Black-Scholes formula to match the market price of the option in Bitcoin that you see here. It is the most standard metric used to measure the level of risk in the market. The higher the implied volatility, the higher the price of this insurance contract, and the higher the market risk expectation.
You can see that the volatility increases for strikes that are further away from the current spot price. It means that there is more fear in sharp extreme movements, and there is relatively more demand for extreme risk protection. When the implied volatility is higher on the upside and the downside: we have what we call à volatility smile.
You’ll find volatility smiles in fiat currency markets as well, it is less common in Equity markets where we usually have what we call a volatility skew: only the downside volatility is much higher.
So why is this market helpful to understand where profit taking might happen, or where the market might be going?
Let’s go back to the distribution of open interest by strike.
We mentioned in previous sessions that we had a high concentration of call options at the 40,000 strike level that are expiring in December. We have nearly 500 million dollars' worth of contracts in notional: we’re talking about an equivalent of 12,500 Bitcoins.
And we talked about it when the Bitcoin price was below 35,000, and I used this observation to say that there is a probability for the market to reach 40,000 by the end of December. There is no guarantee but having a big concentration of options on a specific strike at à specific expiration date: it means that participants have a strong view. And this view is: Bitcoin is very likely exceeding 40,000 dollars by the end of December and it’s worth spending a fraction of that now for insurance.
But the 40,000 level also represents a target level for speculators. Speculators would think: the market exceeded 40,000 as expected, we can sell, and we can sell at any level above 40,000. The 40,000 level acts like a magnet for the Bitcoin price.
There is another reason why the 40,000 level would act like a magnet: if we have close to 500 million$ of call options, there is no way to sell back this large amount in the listed market. The only way to hedge this position is to sell futures that are expiring together with the options, at the same exact level -> this is the perfect hedge, and this supports the “magnet” description of the 40,000 level.
So we think these dynamics are helpful to form a view over the market’s direction. Looking at Jan 2024, we have a big concentration at the 50,000 strike. Therefore, the Bitcoin price could likely reach 50,000 by the end of Jan. Then sizes are much lower or more scattered. But looking at June 2024, the price could fall anywhere between 60,000 and 100,000.
Looking quickly at the other metrics this week:
- Exchange traded volumes have reached their highest level since March. The weekly moving average produced by the Block shows an average at 38.44 billion us dollars
- Most contract liquidations happened on OKx: Okx and Bybit’s market shares for spot and derivative markets are at all-time highs. They absorbed Binance’s market share.
- We mentioned that AVAX is the best performer this week. One potential reason that is covered by the press is the November announcement by asset managers planning to use the Blockchain for asset tokenization. Asset managers include JP Morgan with their blockchain platform Onyx, WisdomTree or Apolllo. But looking at the total value locked on Avalanche measured in AVAX: it’s clearly going down since October. Volumes recorded à new high since March but we’re seeing similar behaviour on Solana. So, we guess it’s all about expectations.
- Finally, Socgen launched a EURO stablecoin this week, listed on Bitstamp with the symbol EURCV. CV stands for “convertible”. There are 10.5 million in circulation. It is fully collateralized
*This is not financial advice. Not intended for UK customers.