
If you’ve ever worked with complex highload cloud infrastructure in Microsoft Azure, you probably understand how important it is to have an appropriate monitoring system.
Unfortunately, there aren’t always ready-made solutions that can guarantee the proper coverage of all required metrics and provide the option for extra customization. Eventually, if you find them, they will likely cost your company a fortune, particularly if you have a complex multicomponent infrastructure. That is why our Wirex R&D team wants to share our experience on implementing a monitoring solution for Microsoft Azure, which could cover all these aspects and be a powerful tool to use on a daily basis.
First, here’s a few words about the company and why we’ve implemented this solution, which will give you a better understanding of what we’re dealing with.
Wirex's entire platform is hosted in the Microsoft Azure cloud. We have a complex multicomponent infrastructure with thousands of transactions and a million events each day. As a fintech product with 3.5 million clients, our platform uses cryptocurrencies in addition to traditional currencies, so we can't allow customers to experience any difficulties during transactions or any delays when exchanging currencies. This imposes certain risks and challenges which means it requires specific monitoring systems that need to be more advanced and dynamic.
What problems did we try to solve with the implementation of the monitoring system in Microsoft Azure?
Here’s the list of our main targets:
- Multicomponent monitoring, including metric collection and coverage of the maximum possible number of components in our cloud.
- Scale Set monitoring (part of the Service Fabric cluster). Without properly monitoring Scale Sets, we can't get full tracking of our cluster.
- Monitoring of microservices. Our platform itself and our entire product consist of many separate services that are interconnected and work in a single cluster. Unfortunately, Microsoft Azure doesn't provide the ability to monitor microservices.
- Continuous monitoring deployment. We want to simplify our monitoring system's deployment process, as the monitoring infrastructure's failing would lead to blind spots.
- Continuous monitoring upgrade. We want to be able to release updates as quickly as possible, often in less than a minute; that's why it should be continuous.
- Alerting. Our goal is to use alerts to cover every Scale Set instance and each service. For example, we want to have thresholds setup on 90% of using compute resources; in this case, we want to determine the particular microservices on a development stage and react immediately if there begins to be a high consumption. We can't afford this service to be deployed to the production because it will significantly impact the product.
Before going any further, let's take a brief look at what we’re dealing with:
- More than 150 Virtual Machines Scale Sets (This is not just a Virtual Machine, this is a set of instances, which, in our case, can be up to 25 Virtual Machines)
- Service Fabriс clusters include about 12 active environments on which development is carried out, and this includes production.
- There are about 50 applications with up to 370 microservices in each environment.
Our goal is to monitor every single Virtual Machine instance, each microservice and receive metrics for every single environment.
What tools can be used for infrastructure monitoring in Microsoft Azure?
Let's start at the beginning with tools Microsoft offers from the box. Azure has a standard Azure Monitor, a great instrument that allows you to get different insights on various services such as Key Vaults, Storage Accounts, VM, Service Health Statuses among all resources. This tool also gives the ability to set up auto-scale for scaling resources, which is really useful to have all in one place. What’s more, you can configure alerts. Azure Monitor has convenient settings for sending notifications regarding service health statuses to any preferred messenger. An added bonus is that it can be easily integrated with our 3rd party products.
Another essential tool from Microsoft is PowerShell, and I think it’s worth mentioning as it's a unique tool with a unique script language. It provides a large number of modules to work with Azure, and you can even cover aspects and metrics of resources that are sometimes hidden and hard to find, such as various different customization tools.
Of course, Microsoft provides a lot more, but we are not going to cover them all. The main point to understand is that we’re still not able to get all the information we need.
In addition to Microsoft tools, we have third-party products that we use to monitor our infrastructure.
- Grafana. This is our main tool for visualization. It provides dashboards that display the monitoring of specific resources.
- Prometheus. We'll talk about this product later.
- Splunk is used for log analytics and for working with Big Data on applications.
- PowerShell provides custom scripts for alerting.
- Azure Monitoring Integration. With the help of Grafana, we can partially get metrics using this integration.
- ELK is a stack for additional integrations and manipulations.
What metrics did we collect when implementing our additional monitoring system?
First of all, we had all of our Application Insights metrics in one place. Azure cache, databases, Virtual Machines, Application Services, Key Vaults, Storage Accounts, and many more. Below is just a brief look at what we have visualized and customized in Grafana.
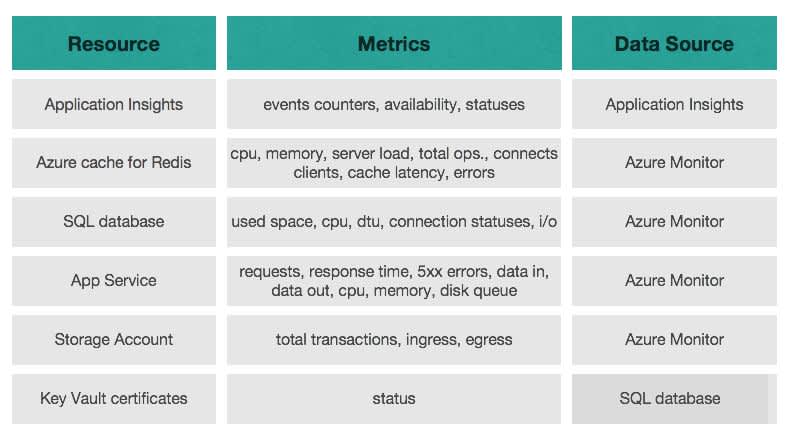
Unfortunately, we were unable to display information on Scale Sets and microservices and this information is not only fundamental but it’s also a goal target of our cluster. The issue is that the integration with Azure Monitor does not provide metrics on output from Virtual Machine Scale Sets. We also didn't know what was happening with our microservices on each instance; so, we tried to solve this problem.
What kind of solution did we come up with?
Our first answer is Prometheus. It's an Open Source product, and, in the world of Open Source projects, it’s quite popular in the monitoring industry, almost as popular as Kubernetes is for cluster orchestration.
How does the Prometheus work?
According to the official documentation, Prometheus scrapes metrics from instrumented jobs, either directly or via an intermediary push gateway for short-lived jobs. It stores all scraped samples locally and runs rules over this data to either aggregate and record new time series from existing data or generate alerts. Grafana or other API consumers can then be used to visualize the collected data.
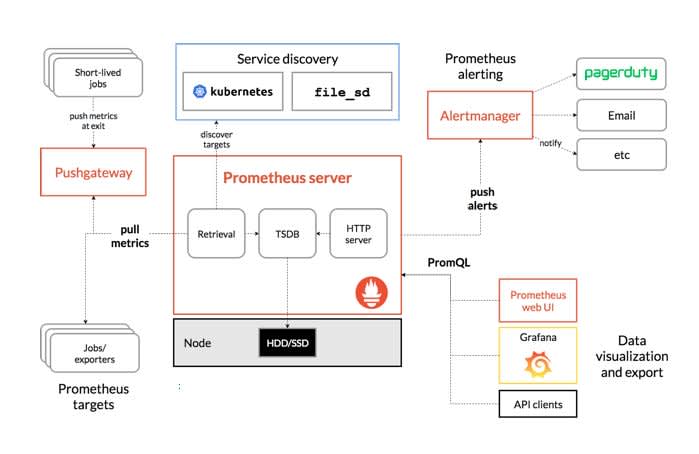
Source: https://prometheus.io/docs/introduction/overview/
What’s useful is that Prometheus includes a local on-disk time series database and optionally integrates with remote storage systems. It might sound like a disadvantage initially, but in general, it’s good to have the extra security in regards to the setup process, as it means there will be fewer points for database failure as well as a direct read/write operation.
Of course, a big plus is that Prometheus can discover Scale Sets automatically with Azure configurations. Why is this a plus for us? Usually, when you write a Prometheus configuration, you have to set each target individually, using the target IP address with its name. But when you have an infrastructure with more than 150 Virtual Machine Scale Sets with more than 20 instances in each set, that's not so convenient.
The question is how to discover each Scale Set, especially the Scale Sets that appear after auto-scaling? Furthermore, would you have the ability to monitor these new, extra Scale Set? The answer is “yes” because it will be automatically discovered, and named as it is in Grafana, which is extremely useful.
Prometheus also has a customization tool called PromQL, which allows you to customize your queries and get the information that you need.
So, here’s the list of main Prometheus benefits:
- It’s an Open Source system monitoring and alerting toolkit.
- It supports fast and reliable deployment through containerized infrastructure.
- Azure SD configurations allow you to discover and retrieve scrape targets from Azure.
- It includes a local on-disk time-series database.
- Grafana supports querying Prometheus (PromQL).
How does Prometheus know what’s happening in each particular instance? And how do we connect Prometheus with our instances? The answer is with Windows Exporter.
Windows Exporter is an extra tool developed by the Prometheus community. It's deployed on each instance of the Virtual Machine Scale Set. And this service collects metrics that were previously set in a pre-deploy. Here's a brief view of available collectors.
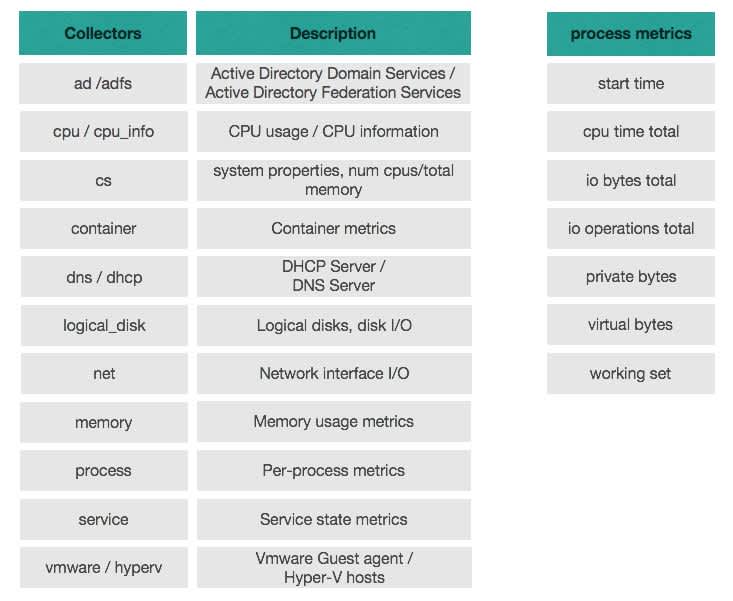
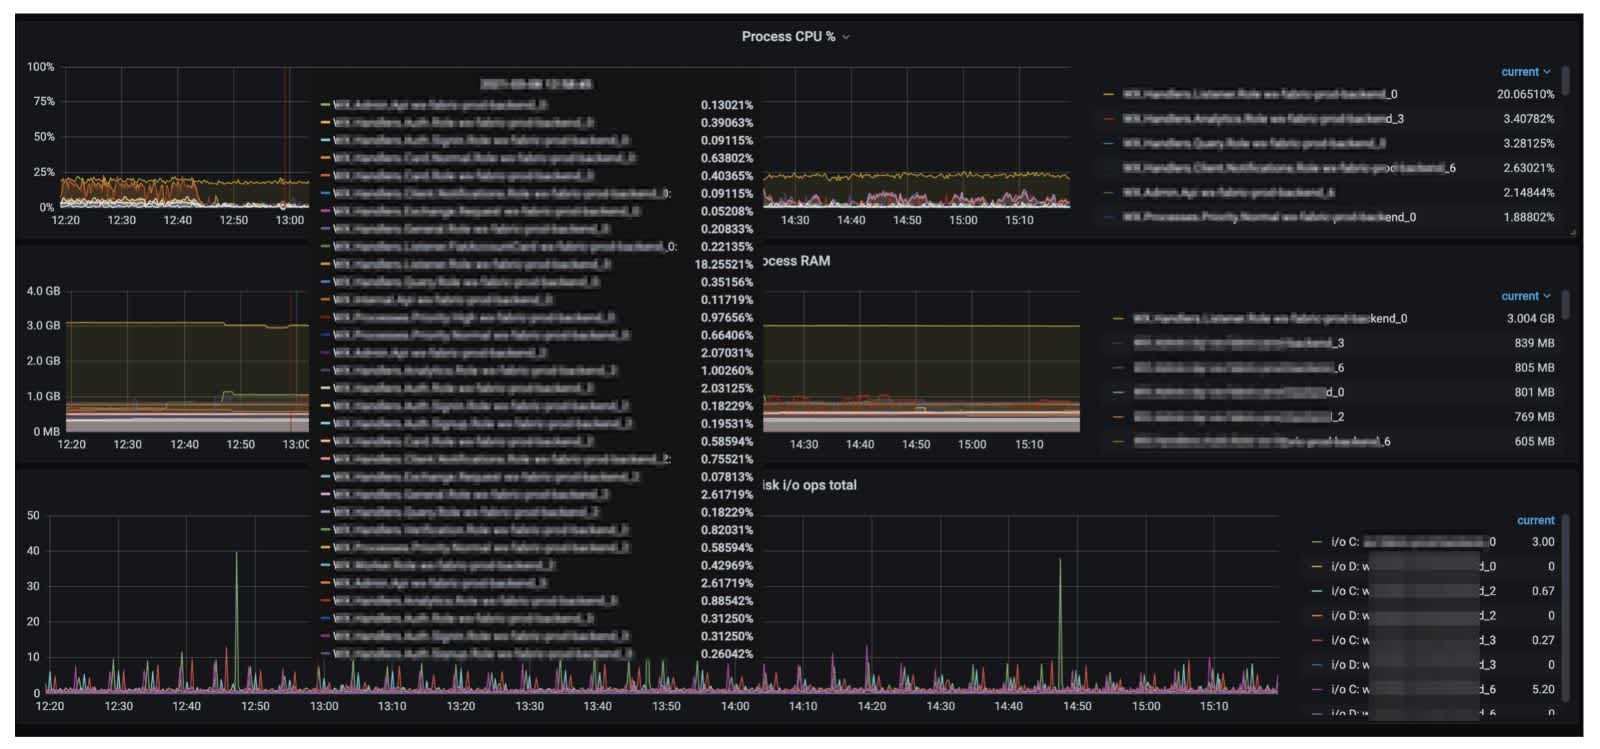
The most important thing here is that we’re able to display information on processes.
Our microservice exists on an instance as a process, so getting metrics for processes allows us to monitor them. We get information specifically for services such as its CPU time, working set, virtual bites, i/o, display of when the process was started, etc.
Also, if you have extra deployed services on your instance that need to be monitored, this isn’t a problem.
How Prometheus Exporter and configuration can be deployed in every instance
In these situations, we use Terraform, DSC configurations and Chocolatey.
- Terraform is our main "infrastructure as a code" tool for managing our infrastructure's deployment in the cloud.
- DSC is a powerful PowerShell extension and a very flexible solution from Microsoft that allows you to manage server configurations.
- Chocolatey or Choco is probably the most popular package manager for downloading additional applications for Windows.
We deploy DSC configuration with the described procedure to install an exporter as a Virtual Machine extension in Azure.
What do these tools give us?
It allows us to manage the infrastructure and control our resources. We can deploy our exporter on every instance and configure continuous configuration deployment. It’s a good advantage as we get rid of all drift configurations, so all our instances are consistent with each other, and that's really remarkable.
How can we visualize the monitoring process?
Here is a monitoring scheme.
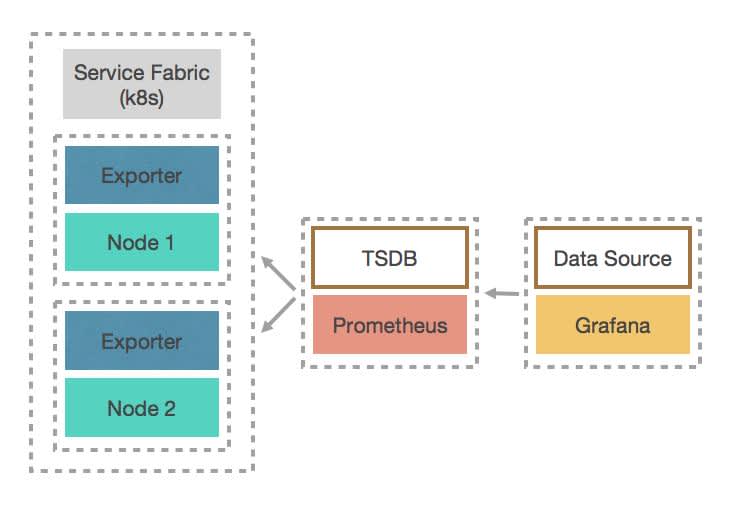
On the left, you can see a Service Fabric cluster which consists of several Scale Sets; it could even be adopted for Kubernetes. Each Scale Set has its own installed Exporter and, of course, deployed application microservices.
Then we have our Prometheus with TSDB and Grafana, which use Prometheus as a data source.
What does Exporter do? It runs on localhost on a specific port (9128, by default) and collects all predefined metrics and posts them. Prometheus then scrapes metrics with configured scrape intervals through HTTP, which could be 5-10-15 seconds, so you can get instant updates.
For example, you could configure your entire monitoring infrastructure as a separate local network and whitelist required connections through firewall rules without exposing resources to the public.
Lastly, you need to configure Grafana to use Prometheus as a data source and customize output through PromQL in order to display all the data on the beautiful dashboards.
How to automate deployment? Here’s how we configured the monitoring system in Continuous mode.
We have a BitBucket repository with Ansible playbooks, which describes the installation process and configuration for Prometheus. We also have TeamCity as our main Continuous Integration (CI) tool that we use for our deployment project builds, allowing them to deploy and update. We have Ansible as a configuration management tool for the deployment of Prometheus of Grafana as a Docker containers. Here, Ansible could be a separate instance, or it could be configured as a TeamCity runner; either option is possible. If you select a runner, it means it will be adapted as a TeamCity plugin.
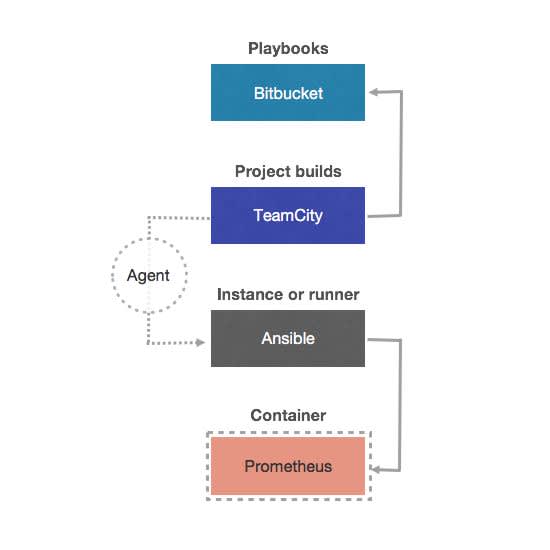
How does the pipeline work?
It’s actually quite simple. TeamCity pulls configuration for our Prometheus configuration and then it triggers Ansible, which is deploying Prometheus as a Docker container. All this running through TeamCity agents.
This is how you can implement your automation pipeline. It could take less than 20 seconds to deploy a new container or update it with our pre-deployed configuration.
What have we got as a result?
Thanks to Grafana and Prometheus, we've got all the metrics we need, and more for all our Virtual Machine Scale Sets instances, plus we’ve got information for the instances themselves and for each microservice in every instance.
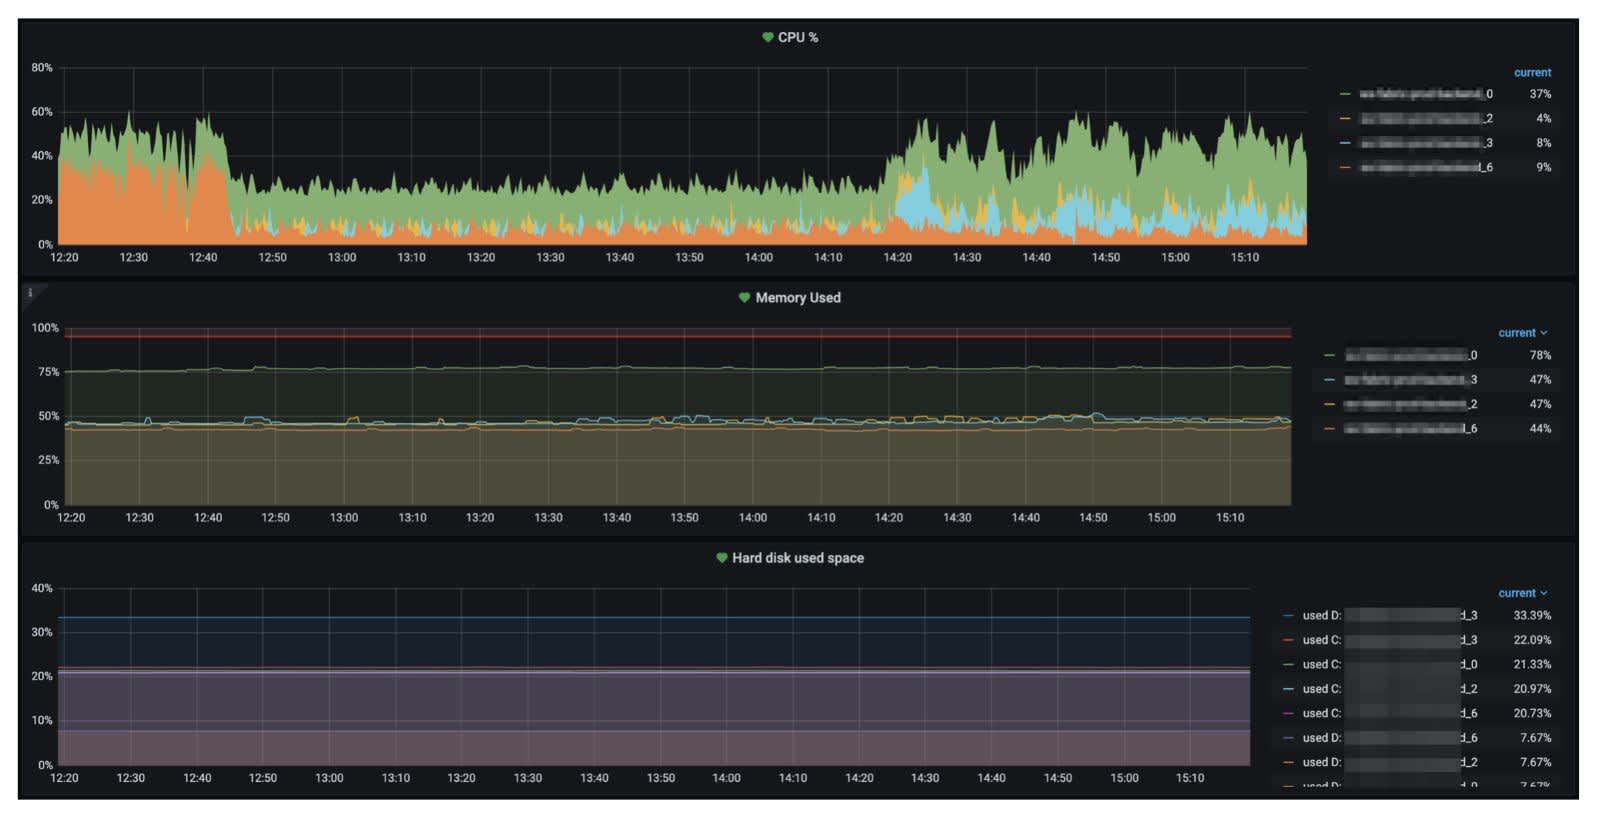
We monitor about 370 microservices in every environment, from development to production and we’ve got metrics for all Scale Sets. We have a better view of what is happening on production, and, as a bonus, we understand what's going on with each service on development before it’s deployed on the production. This means we can be notified and react quickly.
We’re not worried about targeting and auto-naming if auto-scaling goes up or down on our Virtual Machine Scale Sets, we’re still able to monitor each service and instance. Also, we've got configured thresholds alerts, and we are able to receive alerts for a huge number of different events. We also get great customization options. Grafana provides us with the ability to build dashboards as we want, writing the queries to receive all the needed metrics.
Thanks to these tools, we can continuously deploy, re-work, re-design and re-upgrade our infrastructure.